
Businesses generate large amounts of financial and operational data every day. Revenue, expenses, cash flow, sales, customer activity, marketing performance, inventory, and employee productivity all contribute to the overall picture of business performance. However, collecting data is only the first step. Businesses also need an efficient way to understand and act on that information.
This is where business reporting dashboards are becoming increasingly valuable.
Personal finance dashboards have changed how individuals monitor income, expenses, savings, investments, and financial goals. The same dashboard concept can be applied to businesses on a much larger scale. Instead of checking multiple spreadsheets and systems, business leaders can use centralized dashboards to view important metrics, identify changes, and make data-driven decisions.
Modern business reporting dashboards can bring information from accounting software, CRM platforms, ERP systems, e-commerce platforms, marketing tools, spreadsheets, and other business applications into a unified reporting environment.
In this guide, we will explore how dashboard-based reporting is transforming business reporting, the benefits of real-time financial visibility, important dashboard metrics, common implementation challenges, best practices, and how businesses can build effective reporting systems.
What Are Business Reporting Dashboards?
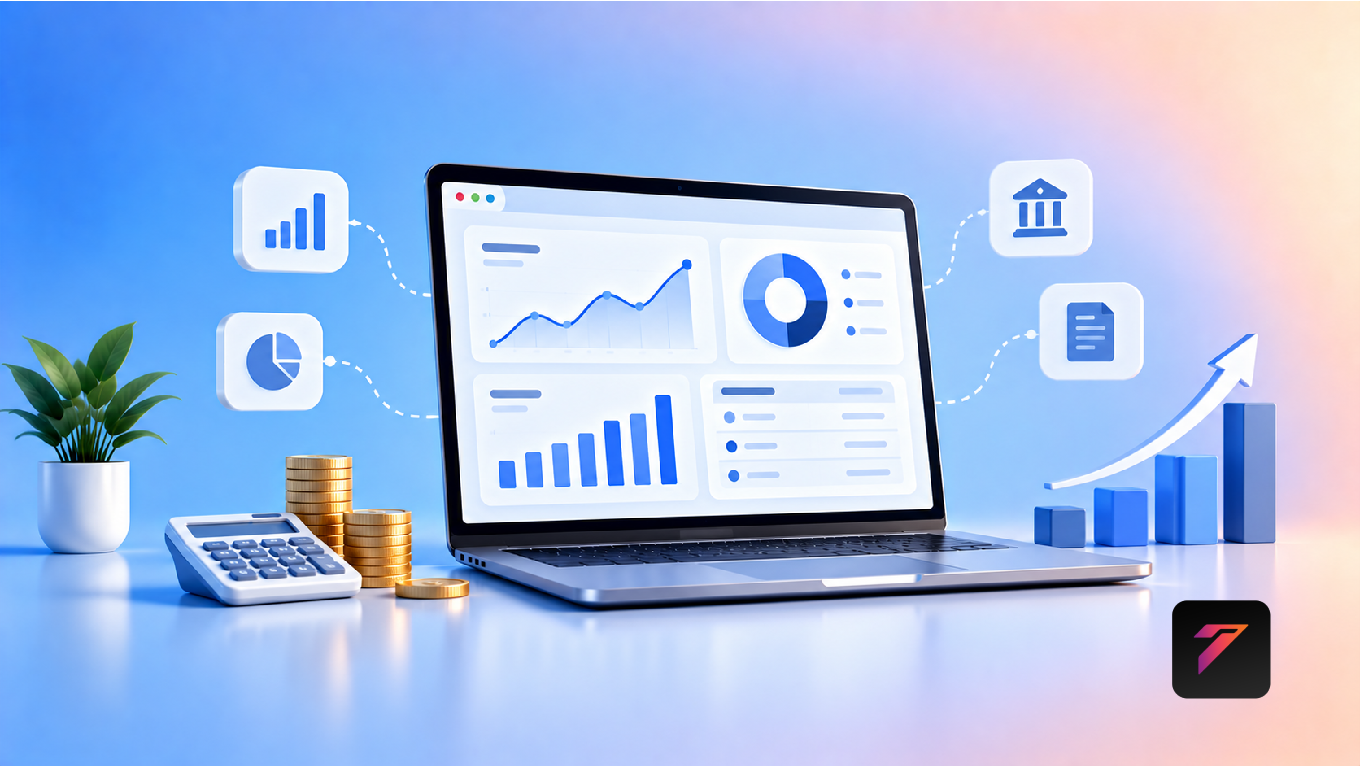
Business reporting dashboards are visual interfaces that organize important business data into charts, graphs, tables, KPIs, and other visual elements.
Instead of reviewing large amounts of raw data, decision-makers can use a dashboard to understand important information quickly.
A business reporting dashboard may display:
- Revenue
- Expenses
- Profit
- Cash flow
- Sales performance
- Customer acquisition
- Marketing results
- Inventory
- Employee productivity
- Operational performance
- Financial forecasts
- Key performance indicators
The exact information depends on the business, industry, department, and reporting requirements.
Build a Website That Grows Your Business
A professionally developed website is the foundation of your online success. If you’re planning to create a responsive, fast, and SEO-friendly business website, explore our Website Development Services to see how Hashseven can help transform your ideas into a powerful digital presence.
What Can Businesses Learn From Personal Finance Dashboards?
Personal finance dashboards are designed around a simple objective: helping people understand where their money comes from, where it goes, and whether they are meeting their financial goals.
Businesses face similar questions at a much larger scale.
A business leader may want to know:
How much revenue did we generate?
Which products generated the most revenue?
What are our largest expenses?
How much cash is available?
Which customers generate the most value?
Are sales increasing or decreasing?
Which marketing channels are producing results?
A dashboard can bring these answers together in one reporting environment.
1. Centralizes Business Information
One of the biggest advantages of dashboards is centralized reporting.
Businesses often store information across multiple systems.
For example:
- Accounting software
- CRM
- ERP
- E-commerce platform
- Marketing platform
- Payroll system
- Inventory software
- Spreadsheets
Without centralized reporting, employees may need to collect information manually.
A dashboard can bring relevant information together and create a more consistent reporting experience.
2. Provides Faster Access to Financial Information
Traditional reporting can require employees to export spreadsheets, clean data, create formulas, prepare charts, and distribute reports.
This process can consume significant time.
With automated business reporting dashboards, important information can be presented through a centralized interface.
Instead of waiting for a monthly report, authorized users may be able to monitor selected metrics more frequently.
This can help businesses respond to changes sooner.
3. Makes Financial Data Easier to Understand
Financial data can become complicated quickly.
A spreadsheet may contain hundreds or thousands of rows.
A dashboard can summarize important information visually.
For example:
Revenue
₹25,00,000
Expenses
₹17,50,000
Operating Profit
₹7,50,000
Monthly Growth
12%
Visual summaries can help decision-makers understand the current situation without reviewing every individual transaction.
4. Improves Cash Flow Visibility
Cash flow is an important consideration for businesses of all sizes.
A dashboard can help management monitor:
- Cash inflows
- Cash outflows
- Accounts receivable
- Accounts payable
- Operating expenses
- Upcoming payments
- Available cash
Better visibility can help businesses identify potential cash-flow pressure earlier.
5. Helps Track Revenue Trends
Revenue can be analyzed by:
- Month
- Quarter
- Year
- Product
- Service
- Location
- Salesperson
- Customer segment
- Sales channel
A dashboard can convert these figures into visual trends.
For example, a line chart can show monthly revenue movement and help users identify periods of growth or decline.
6. Makes Expense Management More Transparent
Businesses need to understand where money is being spent.
Expense dashboards can categorize spending into areas such as:
- Payroll
- Marketing
- Software
- Rent
- Utilities
- Operations
- Logistics
- Professional services
Management can then review spending patterns and investigate unusual changes.
7. Supports Better Budget Monitoring
A business budget represents planned financial activity.
A dashboard can compare:
Budget vs Actual
For example:
| Category | Budget | Actual | Difference |
|---|---|---|---|
| Marketing | ₹2,00,000 | ₹1,80,000 | ₹20,000 |
| Operations | ₹5,00,000 | ₹5,40,000 | -₹40,000 |
| Software | ₹1,00,000 | ₹95,000 | ₹5,000 |
This type of comparison can help managers identify areas where actual spending differs from expectations.
8. Connects Financial and Operational Data
Financial performance does not exist separately from business operations.
Revenue may depend on:
- Number of customers
- Sales activity
- Conversion rate
- Average order value
- Product availability
- Customer retention
A dashboard can connect financial metrics with operational KPIs.
This provides a broader view of business performance.
9. Improves Sales Reporting
Sales teams generate important business data.
A sales dashboard can display:
- Leads
- Opportunities
- Sales pipeline
- Closed deals
- Revenue
- Conversion rates
- Average deal size
- Sales targets
- Salesperson performance
Managers can use this information to understand sales activity and pipeline movement.
10. Connects Marketing Performance With Revenue
Marketing reports often focus on traffic, clicks, impressions, and leads.
However, businesses also need to understand what happens after a lead is generated.
A reporting dashboard can connect:
Marketing Spend → Leads → Opportunities → Customers → Revenue
This can provide a more complete view of marketing performance.
11. Helps Identify Business Trends
Dashboards can make patterns easier to recognize.
For example, a business may discover that:
- Sales increase during specific months.
- Certain products generate more revenue.
- One marketing channel produces more qualified leads.
- Operating expenses are increasing.
- Customer retention is declining.
- Certain locations outperform others.
Identifying trends can help businesses investigate the reasons behind changes.
12. Supports Real-Time Business Monitoring
Some dashboards can update information automatically when connected systems provide current data.
This can help decision-makers monitor important business activities without waiting for manually prepared reports.
However, “real-time” should be defined according to the actual system architecture. Some dashboards update continuously, while others refresh every few minutes, hours, or once per day.
13. Reduces Manual Reporting Work
Manual reporting often involves repetitive tasks.
Employees may need to:
- Export data.
- Combine spreadsheets.
- Clean information.
- Create formulas.
- Build charts.
- Prepare a presentation.
- Send the report.
Automated dashboards can reduce some of this repetitive work.
This allows employees to spend more time analyzing information rather than simply preparing it.
14. Improves Decision-Making
A dashboard does not make business decisions automatically.
Instead, it gives decision-makers better access to information.
For example, if a dashboard shows that customer acquisition costs are increasing, management can investigate:
- Advertising costs
- Conversion rates
- Customer quality
- Sales performance
- Market conditions
The dashboard provides the signal. Business leaders still need to determine the appropriate response.
15. Creates Department-Level Reporting
Different departments need different information.
Finance Dashboard
May include:
- Revenue
- Expenses
- Profit
- Cash flow
- Accounts receivable
- Accounts payable
Sales Dashboard
May include:
- Leads
- Opportunities
- Conversion rate
- Sales revenue
- Pipeline value
Marketing Dashboard
May include:
- Website traffic
- Leads
- Campaign performance
- Cost per lead
- Conversion rate
Operations Dashboard
May include:
- Orders
- Production
- Inventory
- Delivery
- Operational costs
This makes dashboards more relevant to each team.
Key Metrics for Business Reporting Dashboards
The metrics displayed on a dashboard should reflect the organization’s goals.
Revenue
Revenue shows how much money the business generates from its activities.
It can be analyzed by:
- Product
- Service
- Customer
- Location
- Channel
- Period
Gross Profit
Gross profit helps businesses understand revenue after direct costs associated with products or services.
Net Profit
Net profit provides a broader view of financial performance after applicable expenses.
Cash Flow
Cash flow tracks money moving into and out of the business.
Operating Expenses
Monitoring operating expenses can help management understand ongoing business costs.
Accounts Receivable
Accounts receivable shows money owed to the business by customers.
Accounts Payable
Accounts payable shows amounts the business owes to suppliers and other parties.
Customer Acquisition Cost
CAC estimates the cost associated with acquiring a customer.
Customer Lifetime Value
Customer lifetime value estimates the value a customer may generate during the relationship with the business.
Conversion Rate
Conversion rate measures how many users or prospects complete a desired action.
Return on Investment
ROI helps businesses compare investment costs with resulting returns.
Not every business needs every metric. A dashboard should prioritize KPIs that support specific decisions.
Types of Business Reporting Dashboards
1. Financial Dashboards
Financial dashboards focus on:
- Revenue
- Profit
- Expenses
- Cash flow
- Budget
- Forecasts
These are particularly useful for finance teams and business leadership.
2. Sales Dashboards
Sales dashboards track:
- Leads
- Pipeline
- Opportunities
- Deals
- Sales targets
- Revenue
3. Marketing Dashboards
Marketing dashboards can connect campaign activity with business outcomes.
They may include:
- Traffic
- Leads
- Campaign costs
- Conversion rates
- Customer acquisition cost
4. Operations Dashboards
Operations dashboards monitor day-to-day business activities.
Metrics may include:
- Orders
- Inventory
- Production
- Delivery
- Service performance
5. Executive Dashboards
Executive dashboards provide a high-level overview.
They typically focus on a smaller number of important KPIs rather than detailed operational data.
Business Reporting Dashboards vs Traditional Spreadsheets
Spreadsheets remain useful for many businesses.
However, dashboards can provide advantages for recurring reporting.
| Feature | Spreadsheets | Dashboards |
|---|---|---|
| Data visualization | Available | Strong |
| Automated updates | Requires setup | Often supported |
| Real-time monitoring | Limited | Can be supported |
| Recurring reports | Manual or automated | Often automated |
| Interactive filtering | Available | Common |
| Multiple data sources | Possible | Common |
| Executive overview | Requires design | Designed for it |
| Scalability | Can become complex | Depends on architecture |
| Collaboration | Available | Depends on platform |
Dashboards do not necessarily replace spreadsheets. In many organizations, spreadsheets remain useful for analysis while dashboards provide a high-level reporting layer.
How Business Dashboards Integrate With Other Systems
A dashboard becomes more useful when it receives reliable data.
Possible integrations include:
- CRM systems
- ERP platforms
- Accounting software
- Payment gateways
- E-commerce platforms
- Marketing tools
- Inventory systems
- HR software
- Databases
- APIs
API integration can allow different systems to exchange information.
For example:
CRM → API → Data Layer → Reporting Dashboard
This can reduce the need for repetitive manual exports.
Role of APIs in Business Reporting Dashboards
APIs can connect business applications and reporting systems.
For example, an organization may have:
CRM
Customer information
↓
Accounting System
Financial transactions
↓
ERP
Operational information
↓
Dashboard
Combined reporting
The exact architecture depends on the systems involved, data volume, security requirements, and reporting needs.
Data Visualization in Business Reporting
A dashboard should use the right visualization for the right type of information.
Line Charts
Useful for trends over time.
Bar Charts
Useful for comparing categories.
Pie Charts
Can be useful for simple part-to-whole relationships with a small number of categories.
Tables
Useful when users need precise values.
KPI Cards
Useful for highlighting important numbers.
Heatmaps
Useful for identifying patterns across multiple dimensions.
Poor visualization choices can make a dashboard confusing even when the underlying data is accurate.
Why Dashboard Design Matters
A dashboard should not simply display as much data as possible.
Good dashboard design considers:
- Information hierarchy
- Visual clarity
- Consistent terminology
- Appropriate charts
- Filtering
- Navigation
- Responsive design
- Accessibility
The most important metrics should be easy to find.
Avoid Dashboard Overload
Displaying too many charts can reduce usefulness.
Instead of showing 30 metrics, a dashboard might prioritize 5–10 key indicators and allow users to explore additional information when required.
The goal is not to display everything.
The goal is to display what matters for the decision being made.
Mobile-Friendly Business Reporting Dashboards
Business leaders increasingly access information from mobile devices.
A responsive dashboard should work across:
- Desktop computers
- Laptops
- Tablets
- Smartphones
Mobile dashboards may require a simplified layout because a desktop dashboard containing multiple charts may not translate well to a small screen.
Important KPIs should remain accessible without excessive scrolling or zooming.
Dashboard Security and Access Control
Business reporting dashboards often contain sensitive information.
This may include:
- Revenue
- Salaries
- Customer data
- Financial transactions
- Business costs
- Sales information
Businesses should implement appropriate security controls.
Important considerations include:
- Authentication
- Authorization
- Role-based access
- Data encryption
- Secure APIs
- Audit logs
- Session management
- Regular security reviews
For example:
Finance Team → Financial Reports
Sales Team → Sales Reports
Management → Executive Reports
Users should receive only the information appropriate for their responsibilities.
Data Accuracy Is Critical
A visually impressive dashboard is not useful if its data is incorrect.
Businesses should establish processes for:
- Data validation
- Duplicate detection
- Data synchronization
- Error handling
- Source verification
- Data refresh monitoring
Dashboard users should also understand where important metrics come from.
A KPI without a reliable data source can create misleading conclusions.
Common Business Dashboard Mistakes
1. Tracking Too Many KPIs
More metrics do not automatically mean better reporting.
2. Using the Wrong Charts
The wrong visualization can make trends difficult to understand.
3. Ignoring Data Quality
Incorrect data can result in incorrect decisions.
4. No Clear Business Objective
A dashboard should have a purpose.
5. Poor Mobile Design
Users may struggle to access reports on smaller screens.
6. Weak Security
Sensitive business information should not be exposed unnecessarily.
7. Manual Data Collection
Excessive manual processes reduce the benefits of automation.
8. No User Training
Employees need to understand how metrics are calculated and interpreted.
9. Ignoring Historical Data
Current numbers become more meaningful when users can compare them with previous periods.
10. Overcomplicated Interfaces
A dashboard should make reporting easier rather than creating another complicated system.
Best Practices for Business Reporting Dashboards
Businesses should:
- Define the dashboard’s purpose.
- Identify the target users.
- Select relevant KPIs.
- Use reliable data sources.
- Automate data collection where appropriate.
- Keep the interface simple.
- Use appropriate visualizations.
- Provide historical comparisons.
- Enable useful filtering.
- Make dashboards responsive.
- Implement appropriate access controls.
- Protect sensitive business information.
- Validate data regularly.
- Document KPI definitions.
- Monitor data-refresh processes.
- Test dashboard usability.
- Collect user feedback.
- Remove unnecessary metrics.
- Review dashboard performance regularly.
- Connect dashboards with broader business systems.
How to Build a Business Reporting Dashboard
Step 1: Define Business Objectives
Start by asking:
What decision should this dashboard help users make?
For example:
- Monitor profitability
- Track sales
- Control expenses
- Monitor cash flow
- Analyze marketing performance
Step 2: Identify Data Sources
List the systems containing the required information.
Step 3: Define KPIs
Select metrics that directly support the dashboard objective.
Step 4: Plan the Data Architecture
Determine how information will move from source systems to the dashboard.
Step 5: Connect Data Sources
Use APIs, databases, connectors, or other appropriate integration methods.
Step 6: Build the Dashboard
Create the interface using suitable charts, tables, KPI cards, filters, and navigation.
Step 7: Add Security
Implement authentication and role-based access where required.
Step 8: Test the Data
Verify that dashboard figures match the source systems.
Step 9: Test User Experience
Check the dashboard on different devices and screen sizes.
Step 10: Monitor and Improve
Review usage and feedback to identify opportunities for improvement.
The Future of Business Reporting Dashboards
Business reporting is increasingly moving toward automated and intelligent systems.
Future dashboard environments may incorporate:
- AI-assisted analytics
- Automated anomaly detection
- Predictive analytics
- Natural-language queries
- Automated reporting
- Forecasting
- Real-time data integration
- Personalized dashboards
- Advanced data visualization
For example, instead of manually reviewing dozens of charts, a user may ask:
“Why did operating expenses increase this month?”
An intelligent reporting system could identify relevant changes and direct the user toward the underlying data.
However, automated insights still require reliable data and appropriate human review.
Conclusion
Business reporting dashboards are transforming how organizations collect, visualize, and understand business information.
The concept is similar to personal finance dashboards: instead of manually reviewing every transaction, users receive a structured overview of the information that matters most. Businesses can apply this concept to revenue, expenses, cash flow, sales, marketing, operations, customer activity, and other important areas.
The real value of a dashboard does not come simply from attractive charts. It comes from reliable data, appropriate KPIs, useful integrations, clear visualization, strong security, and a design that supports real business decisions.
When connected with CRM, ERP, accounting systems, APIs, databases, and automation tools, dashboards can become an important part of a modern business reporting infrastructure.
Frequently Asked Questions
1. What are business reporting dashboards?
Business reporting dashboards are visual reporting interfaces that organize important business information such as revenue, expenses, sales, cash flow, KPIs, and operational data into charts, tables, and other visual elements.
2. How do business reporting dashboards improve reporting?
They can centralize information, reduce repetitive manual reporting work, simplify complex data, provide faster access to KPIs, and help decision-makers identify important trends.
3. What should a business reporting dashboard include?
The dashboard should include metrics relevant to its purpose. Common examples include revenue, expenses, profit, cash flow, sales performance, conversion rates, customer metrics, and operational KPIs.
4. Can business reporting dashboards connect with CRM and ERP systems?
Yes. Depending on the platforms and available integrations, dashboards can connect with CRM, ERP, accounting, e-commerce, databases, APIs, and other business systems to consolidate relevant information.
5. Are business reporting dashboards useful for small businesses?
Yes. Small businesses can use dashboards to monitor important metrics such as sales, revenue, expenses, cash flow, customer acquisition, and operational performance. The dashboard should be appropriately sized for the business’s actual reporting needs.
Ready to Build a Professional Website for Your Business?
Turn your business into a powerful online brand with Hashseven.
Since 2017, we’ve helped businesses grow through professional website development, mobile apps, custom software, SEO, digital marketing, CRM, POS solutions, and Meta-approved WhatsApp automation. Let’s create a fast, secure, and conversion-focused website that attracts more customers and drives real business growth.